In August 2026, Chatham had 46 single-family homes for sale, down 30.3% from August 2025. With roughly a third fewer houses on the market, prices would normally be expected to rise. The median sale price that month fell 9.4% to $1,150,000, according to the Massachusetts Association of Realtors town data for August 2026.
The quarter before shows the same kind of mismatch. In the Cape Cod & Islands Association of REALTORS Q2 2026 report, Chatham's median sale rose 6.1% from the year before. Its average sale fell 16.8%. Both figures describe the same town over the same months.
Chatham values are not moving two ways at once. What changed in 2026 is which homes are selling, and that change in the mix is large enough to move the headline numbers by itself. A buyer who checks an asking price against "the Chatham median" is comparing one house to a basket of sales whose contents keep changing.
Thirty-Two Sales, Two Different Stories
Here are CCIAOR's Q2 2026 figures for Chatham, with data current as of August 12, 2026.
| Q2 2026, Chatham | Figure | Change from Q2 2025 |
|---|---|---|
| Number of sales | 32 | +45.5% |
| Total dollar volume | $67,484,650 | +21.0% |
| Median sale | $1,400,000 | +6.1% |
| Average sale | $2,108,895 | −16.8% |
| Median days on market | 11 | 13 days fewer |
Look at the top two rows. The number of sales rose almost 46%, but dollar volume rose only 21%. If the extra sales had been priced like the 2025 sales, volume would have grown about as fast as the count. It grew at less than half that rate, so the added sales were cheaper than the average sale a year earlier.
You can work out last year's figures from the reported changes. Q2 2025 had about 22 Chatham sales and about $55.8 million in volume, which puts the average near $2.5 million. In Q2 2026, about ten more homes sold and total volume grew by roughly $11.7 million. That works out to about $1.17 million per added sale, which is below the quarter's $1.4 million median and well below the 2025 average.
So the growth in Chatham's spring market came from homes priced in the low seven figures. Those sales pulled the average down because each one carries less weight in a dollar-weighted figure. They raised the median slightly because they landed near the middle of the range. Nothing in the table says a given Chatham house lost value.
CCIAOR also reports by village, so its "Chatham" line may not include every sale within the town's borders. That is one more reason the line describes a particular set of sales and not the whole town.
The Top Tier Still Sells, One Property at a Time
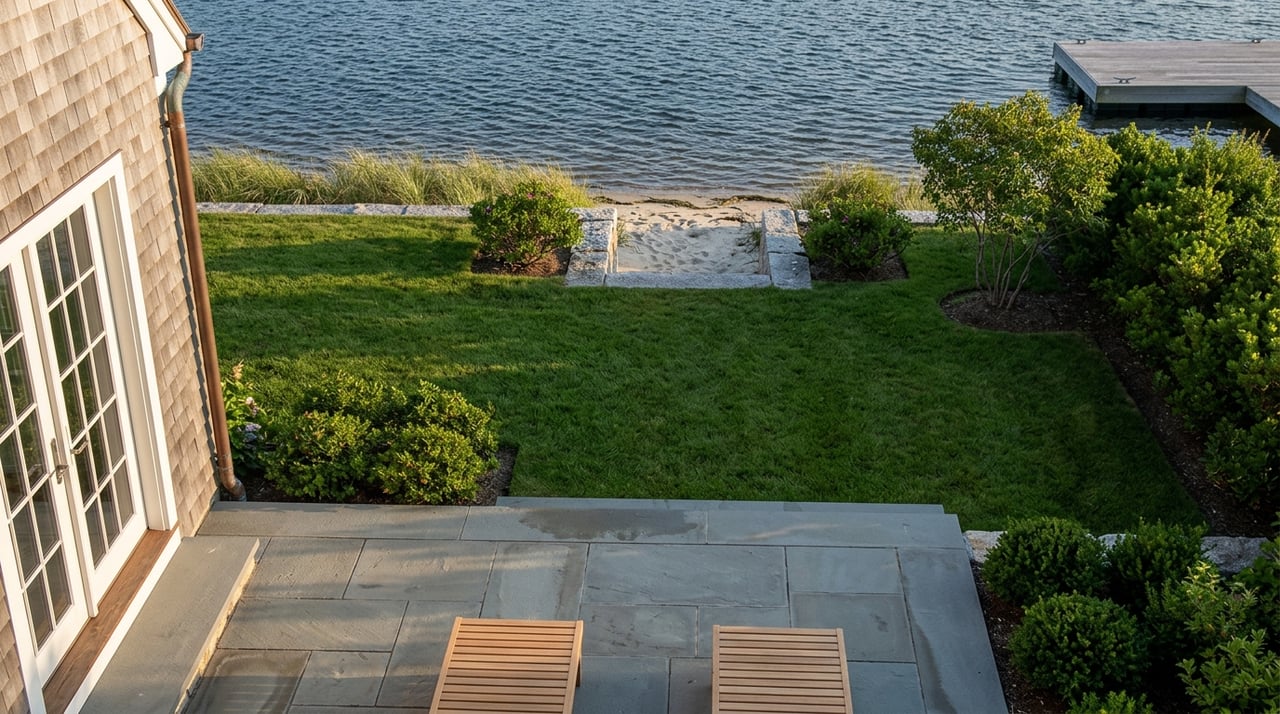
A smaller average does not mean the high end went quiet. In May 2026, the Boston Business Journal reported, in a story carried by NBC Boston, that 150 Main St. in Chatham sold for $6 million. The waterfront home has seven bedrooms, 2,552 square feet and its own private beach. In June, the Boston Business Journal reported that two Chatham homes sold for more than $5 million within days of each other.
At 2,552 square feet, 150 Main St. is not a large house by estate standards. Its $6 million price reflects the water and the private beach. A median per square foot or a town-wide median has no way to account for either. Boston.com reported a $6.95 million asking price in February. The reported sale was about $950,000 below that figure. The public record does not show whether the asking price changed in between, so the gap is a starting ask set against a final price, not evidence of a price cut.
Large homes across the Cape show a similar pattern. In Q2 2026, homes of 4,000 square feet or more accounted for 37 sales Cape-wide, 14% fewer than a year earlier, at a median of $2.65 million, down 1.7%. The number of top-tier sales fell much more than their prices did. When fewer of these sales land in a quarter, every average that includes them falls, even though each individual sale held its value.
Tony Guthrie of the Guthrie Schofield Group at Berkshire Hathaway HomeServices Robert Paul Properties described the same pattern in looking back at 2025 for the Cape Cod Chronicle:
"The high end is still moving, but it's selective."
He added that because inventory is limited at lower price levels, "when something [of] quality comes on, it's competitive." That fits the Q2 numbers. Competition is strongest in the middle of the market, and the top sells only when a particular property matches a particular buyer.
Why August Can't Settle the Question
August's 9.4% drop in the median came from nine sales. MAR's own table notes that "activity for one month can sometimes look extreme due to small sample size," and that the median "does not account for seller concessions." With nine sales, the median is the fifth-highest price. One or two more modest houses closing that month, or one waterfront closing moving into September, would be enough to change it.
The inventory figure is more useful. With 46 homes for sale in August, Chatham had about 20 fewer listings than a year earlier. The county's supply also tightened, but much less. CCIAOR's August 2026 report counted 1,088 active single-family listings in Barnstable County, compared with 1,160 a year earlier, and days on market fell from 54 to 47. The county median rose to $816,900 from $779,000 on 241 closings. Chatham's listings fell 30.3%, while the county's fell about 6%, so Chatham's supply dropped nearly five times as fast in percentage terms.
Fewer listings combined with more sales in the low seven figures points to buyers taking the mid-priced homes as soon as they appear. The 2025 baseline supports this. The Cape Cod Chronicle reported 145 Chatham single-family sales in 2025, up 3.6%, at a median of $1,550,000, up 10.3%, with homes in Chatham staying on the market about 90 days. The Q2 2026 median of 11 days on market comes from a different source and a different measure, so the two can't be compared directly. Still, it describes a market where homes that are priced right in that range don't sit for long.
Reading a Chatham Asking Price Against the Right Comparison
If the headline numbers mostly reflect the mix of sales, a useful benchmark has to hold the mix constant. In practice, a Chatham comparison usually rests on these:
- Sales in the same price band. A $1.3 million home is competing in the busiest part of the 2026 market, where the extra Q2 sales were concentrated. A $5 million home is compared with a handful of sales spread over many months, and those few sales are what make the town average jump.
- The features that set top-tier prices. At 150 Main St., the water and the private beach explain the $6 million price better than square footage does. Comparable sales at that level need to share those features. Similar size alone is not enough.
- More than one month of data. With nine sales in a month, the August median is too thin to show a trend. A full quarter, or the 145 sales of 2025, gives a much steadier picture.
- Supply in that band. The 30.3% drop in listings shows how scarce homes are overall. What matters for a specific house is how many similar homes are listed now. That count can be very different in the low seven figures than near $5 million.
A Few Direct Answers
Did Chatham home values fall in 2026? The data we have doesn't show that. The 16.8% drop in the Q2 average came with a 6.1% rise in the median and a 45.5% rise in the number of sales. Those three figures together describe more mid-priced sales, not lower values.
Why is the August median lower than last year's? It comes from nine closings, and MAR itself cautions that one month can look extreme with a sample that small.
Is the high end still active? Yes. Reported sales include $6 million at 150 Main St. in May and two Chatham sales above $5 million in June. Sales at that level are infrequent, so a quarter with fewer of them looks weak on paper even when individual prices hold.
If you are weighing a Chatham property against figures like these, Paul Grover can take you through the sales that actually compare to it, by price band and by setting. Start a confidential conversation.